What does mean mean, really?
Shayne Fletcher is hooked on computer programming, and we are hooked on his blog. His most recent posts are a irresistible introduction to some fundamental statistics via OCaml programming, among them a total of five different definitions of the mean value of a sequence. In this post we continue Shayne’s discussion with a side dish of calculus and R thrown in for good measure. You should really read Shayne’s blog posts on statistics and power means before you continue reading this.
Shayne introduces five different means: arithmetic, harmonic, geometric, quadratic, and power. Given a sequence of numbers , the formulae for these five means are:
It is evident that the harmonic mean, arithmetic mean, and quadratic means are special cases of the power means when , , and respectively. However, the geometric mean looks like it doesn’t fit in.
The power mean is undefined when because of that pesky exponent . However, since the power mean is defined for all nonzero value of , it is in particular defined for near zero and hence we can take a limit. We even get to invoke L’Hopital’s rule along the way.
For ease of notation, let represent the sum
Notice that and
which implies that . Knowing both and allows us to calculate the limit of the power means:
Thus the geometric mean is simply the limit of the power mean.
So now that we are viewing everything as special cases of power mean, how do we go about interpreting the parameter ? Well, simply put, the greater that is, the closer that the power mean will be to the maximal element in our sequence. Conversely, power means for negative values of are closer to the minimal element of our sequence.
Let’s visualize this using R, by generating a sequence of 100 samples from the uniform distribution . We plot the power mean of this sequence against using the code below.
library(ggplot2)

# change these parameters if you want
max = 100
num_samples = 100

# generate 100 samples from 0 to 100
samples <- max * runif(num_samples)

# my power mean function
powermean <- function(samples, d) {
    if (d == 0) {
        exp(sum(log(samples)) / length(samples))
    } else {
        (sum(samples ^ d) / length(samples)) ^ (1 / d)
    }
}

# x axis goes from -10 to 5 skipping 0
d <- c(seq(-10,-0.01,by = 0.01), seq(0.01,10,by = 0.01))

# calculate all the power means
y <- sapply(d, function(d) powermean(samples, d))

myPlot <- ggplot() +
    geom_line(aes(x = d, y = y), color = "#56B4E9") +
    geom_point(size = 5,
               aes(x = -1, y = powermean(samples, -1),color = "#E69F00")) +
    geom_point(size = 5,
               aes(x = -0, y = powermean(samples, 0), color = "#009E73")) +
    geom_point(size = 5,
               aes(x = 1, y = powermean(samples, 1), color = "#F0E442")) +
    geom_point(size = 5,
               aes(x = 2, y = powermean(samples, 2), color = "#0072B2")) +
    scale_color_manual(values = c("#E69F00","#009E73","#F0E442","#0072B2"),
                       breaks = c("#E69F00", "#009E73", "#F0E442", "#0072B2"),
                       labels = c("harmonic",
                                  "geometric",
                                  "arithmetic",
                                  "quadratic")) +
    theme(axis.title.x = element_blank()) +
    theme(axis.title.y = element_blank()) +
    theme(legend.title = element_blank())

# ...profit!
plot(myPlot)
This code generates the pretty picture below.
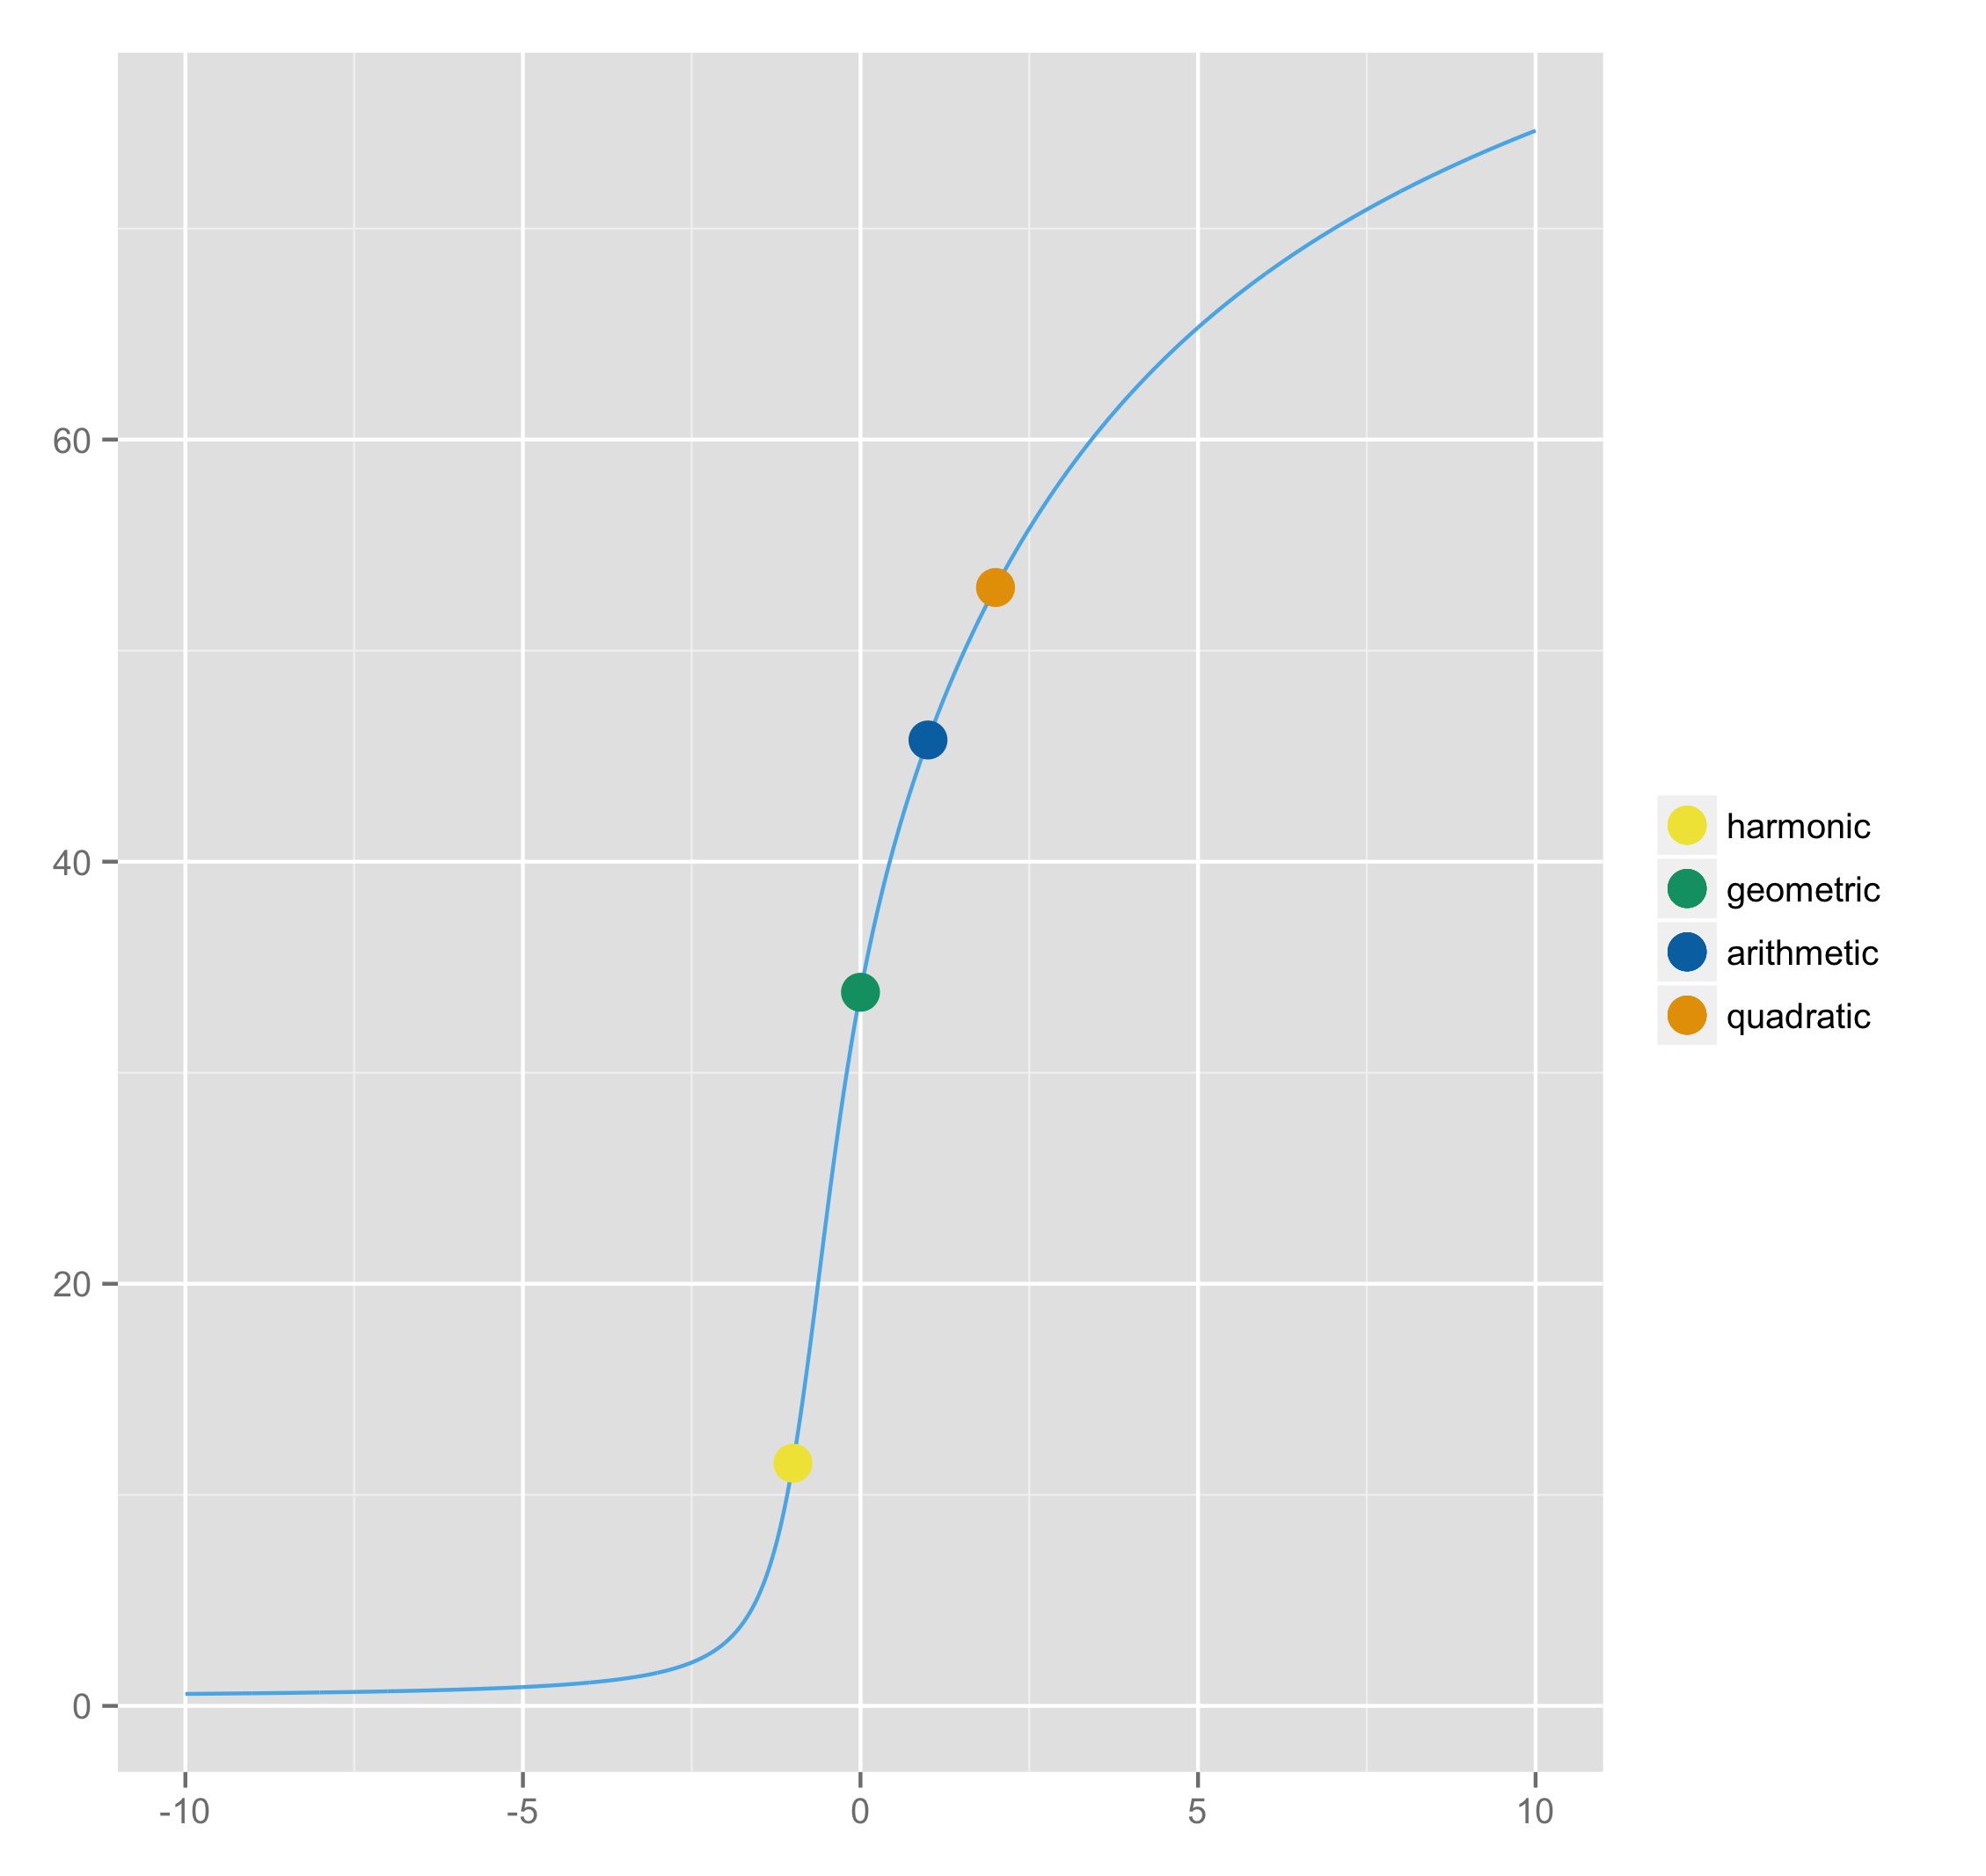
You can see in this case that we have a progression harmonic mean < geometric mean < arithmetic mean < quadratic mean, which is consistent with our observation that the power in the power means formula represents how close the mean will be to the smallest or largest element of our sequence (in this case 1 and 99). This is an example of the generalized mean inequality, which states that if we define as
then implies
blog comments powered by Disqus